


![How to [use view tools for stock analysis]](https://mlrg9duubyly.i.optimole.com/cb:kDHN.65d39/w:1024/h:536/q:mauto/ig:avif/https://techtunecentre.com/wp-content/uploads/2024/09/How-to-use-view-tools-for-stock-analysis-final.png)
How to [use view tools for stock analysis]
💥Today I will share with you how to [use view tools for stock analysis], I hope it will be helpful to you!
💥If you love learning, please take good notes.
If you don’t have a line drawing tool, you can use KLSE Screener or Investing and Trading View. All three platforms have line drawing tools.
First:
Copy Trading View and search on Google, then find the above page and click to enter the official website
Second
Search for the stock name you want to view

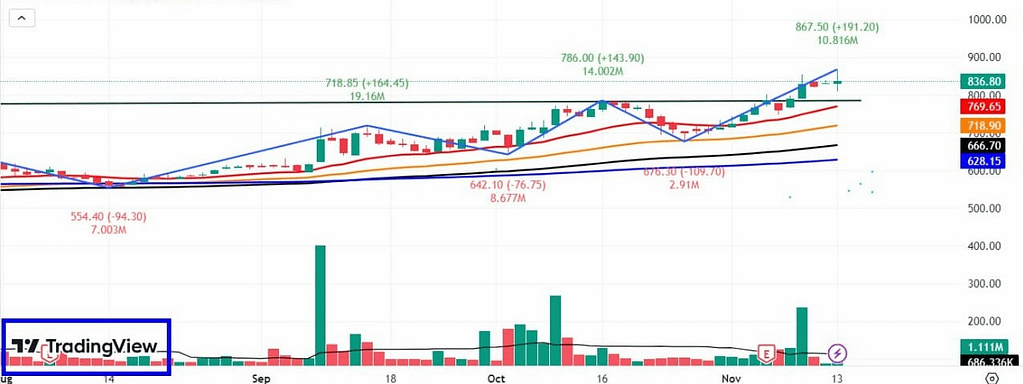
After you search, you can see the chart trend analysis. Of course, your indicators are different.
If you want to find the chart indicators I currently use, then continue to read my sharing below
How many indicators can be set in this Trading View?
We currently use three indicators. Of course, you can set more, but you need to apply for membership on the Trading View official website.
It’s OK if you don’t apply, because you can switch back and forth between the three indicators.
Please see the arrow in the picture above. Click to the following window and select SWING TRADING
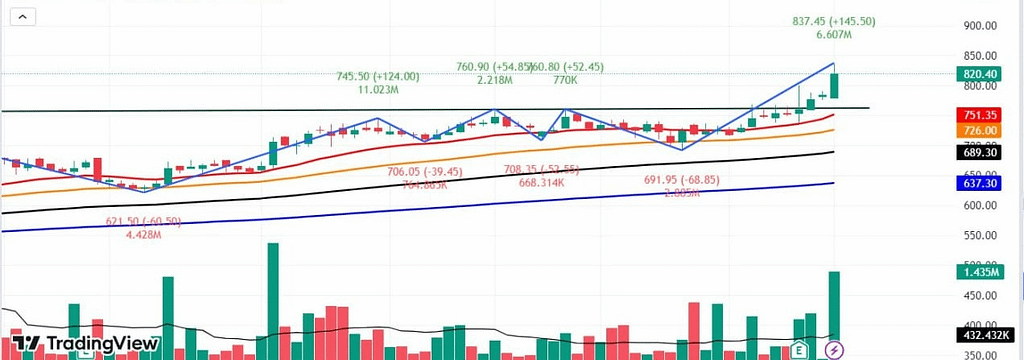
Then you will see the chart shown below

Then you will see the chart shown below
Next, delete two useless indicators.
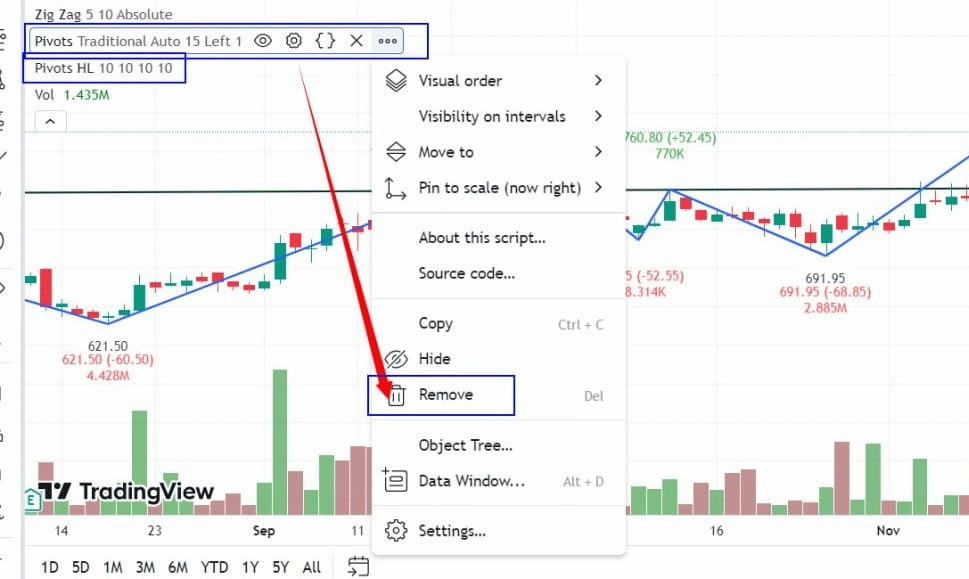
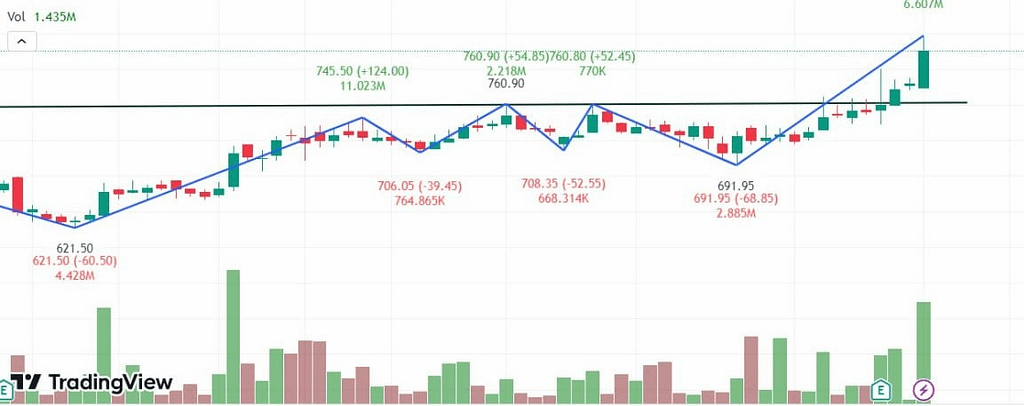
Keep zig zag and vol
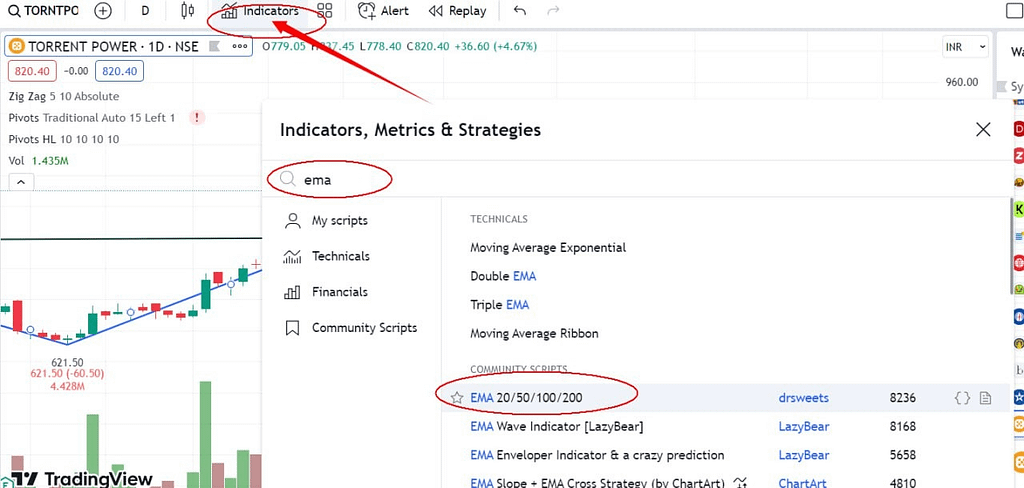
Finally, according to the above chart, enter EMA where the arrow points.
Find the EMA20/50/100/200 circled below
Then complete the final settings
💯The above is a simple summary of the line drawing tools I have used in my many years of stock market investment, and it is also the most effective combination of indicators for viewing charts.
💯, If there are still students who don’t understand, please read the screenshots I shared tonight carefully. I believe you can learn it!
*******Now everyone can take action and learn to use it together*******